Engineers Garage

  • Projects and Tutorials
    • Circuit Design
    • Electronic Projects
      • 8051
      • Arduino
      • ARM
      • AVR
      • PIC
      • Raspberry pi
      • STM32
    • Tutorials
    • Components
  • Articles
    • EG Blogs
    • Insight
    • Invention Stories
    • How to
    • What Is
    • News
      • EE Design News
      • DIY Reviews
      • Guest Post
      • Sponsored Content
  • Forums
    • EDABoard.com
    • Electro-Tech-Online
    • EG Forum Archive
  • Digi-Key Store
    • Cables, Wires
    • Connectors, Interconnect
    • Discrete
    • Electromechanical
    • Embedded Computers
    • Enclosures, Hardware, Office
    • Integrated Circuits (ICs)
    • Isolators
    • LED/Optoelectronics
    • Passive
    • Power, Circuit Protection
    • Programmers
    • RF, Wireless
    • Semiconductors
    • Sensors, Transducers
    • Test Products
    • Tools
  • EE Resources
    • DesignFast
    • LEAP Awards
    • Oscilloscope Product Finder
    • Video
    • White Papers
    • Webinars
  • EE Learning Center
  • Women in Engineering

Temperature Plot Using Processing and Arduino

November 11, 2014 By Salman Khan


The plotting of data on a graph is used to observe and subsequently describe the visible patterns that exist within the data. The main aim of this project is to show, how to plot a variable graph using processing environment and Arduino. In this article temperature is plotted on the processing graph. Processing environment is quite similar to Arduino but the difference is that in the former we can plot the graph whereas in  the latter we can’t plot any type of graph. Processing Environment is very useful in cases of plotting Analog graphs.Processing Environment is very useful in cases of plotting Analog graphs. For this project reader need to know how to start with arduino. 

Graph showing temperature plot on Processing Application

Fig. 1: Graph showing temperature plot on Processing Application


Prototype of Arduino based Temperature Sensor

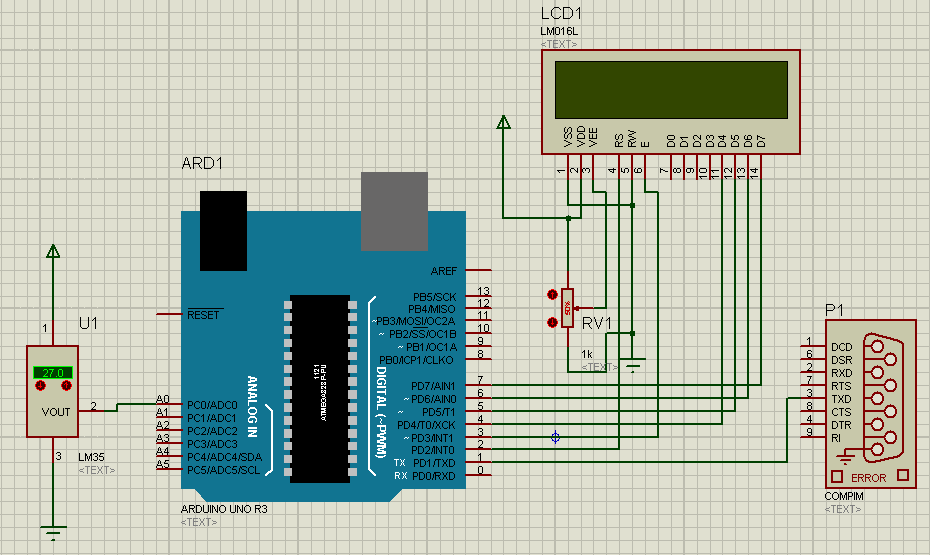
Fig. 2: Prototype of Arduino based Temperature Sensor

Here we are going to discuss plotting temperature graph on computer or laptop using Processing Environment and Arduino. Circuit of reading temperature is very simple. In this system only one circuit LM35 temperature Detector / Reader is used and directly connected with Analog pin number A0 of Arduino. And a 16×2 lcd interfaced with arduino is connected with this circuit for displaying temperature. See the block diagram given below to understand the working of this project.

Block Diagram of Arduino based Temperature Sensor

Fig. 3: Block Diagram of Arduino based Temperature Sensor

From Arduino, we just read Analog output of temperature sensor and after some calculations Arduino sends data for Processing by using FTDI basic breakout. But you can use any of TTL logic converters to communicate with Desktop or Laptop with Arduino. But in Arduino UNO, there is no need of any other external converter because Arduino UNO Board is already configured with logic converter. But if you have Arduino UNO at home or lab then you should have a TTL Logic Converter.

Displaying the Graph

The formula for calculation of temperature given below:

Temperature= Analog reading * (5.0/1023.0) * 100;

Processing: Processing is an Environment like Arduino. In Arduino we uses

Temperature= Analog reading * (5.0/1023.0) * 100;
 
Processing: Processing is an Environment like Arduino. In Arduino we use
 
Void setup()
 
{
 
}
 
Void loop()
 
{
 
}
 
But in processing we use
 
Void setup()
{
 
}
 
And
 
Void draw()
 
{
 
 // main program;
 
}
 
Line (x1,y1,x2,y2)
 
This function is used for plotting line on graph. The trace in graph is also plotted by using this function.
 
Where:
 
X1 is starting point in x direction on graph.
 
Y1 is starting point in y direction on graph.
 
X1 is ending point in x direction on graph.
 
Y1 is ending point in y direction


Screenshot of Code used to plot a line on Processing Application

Fig. 4: Screenshot of Code used to plot a line on Processing Application

Screenshot of a line plotted on Processing Application

Fig. 5: Screenshot of a line plotted on Processing Application

Font and Text

By using text function we can plot text on graph window.
 
Text(“text”, x , y);
 
Where:
 
Text= text as you want to plot.
 
X = position of text in x direction.
 
Y = position of text in y direction.
 

Screenshot of Code used to display text on Processing Application

Fig. 6: Screenshot of Code used to display text on Processing Application

Screenshot of text displayed on Processing Application

Fig. 7: Screenshot of text displayed on Processing Application


Port

myPort = new Serial(this, Serial.list()[0], 9600);
 
selecting port
 
where:
 
serial.list()[0]  Port
 
9600 is baud rate


Circuit

Please refer to the circuit diagram tab for circuit of this project


Components Used

1. Arduino
 
2. Processing software (Environment)
 
3. LM35
 
4. Power supply
 
5. Connecting wires
 
6. FTDI breakout
 
7. 16×2 LCD
 
8. POT
 
9. Computer/Laptop
 
10.Solder Iron 

Project Source Code

###

// Arduino Code

#include<LiquidCrystal.h>
#define sensor A0
float analog_value;
LiquidCrystal lcd(2,3,4,5,6,7);

byte degree[8] =
              {
                0b00011,
                0b00011,
                0b00000,
                0b00000,
                0b00000,
                0b00000,
                0b00000,
                0b00000
              };

void setup()
{
   lcd.createChar(1, degree);
  lcd.begin(16,2);
  Serial.begin(9600);
  pinMode(sensor, INPUT);
 
  lcd.setCursor(0,0);
  lcd.print("Temperature Plot");
  lcd.setCursor(0,1);
  lcd.print("Using Proccesing");
  delay(2000);
  lcd.clear();
  lcd.setCursor(0,0);
  lcd.print(" By Saddam Khan ");
  lcd.setCursor(0,1);
  lcd.print("ENGINEERS GARAGE");
  delay(2000);
  lcd.clear();
}

void loop()
{
  float reading=analogRead(sensor);
  analog_value=reading*(5.0/1023.0)*100;
 
  lcd.setCursor(0,0);
  lcd.print("  Temperature  ");
  lcd.setCursor(4,1);
  lcd.print(analog_value);
  lcd.write(1);
  lcd.print("C");
  Serial.println(analog_value);
  delay(700);
}


// ------------------------------------------------------------------------------------
// Processing Code

 import processing.serial.*;
 PFont f;
 PFont F;
 Serial myPort;        // The serial port
 int xPos = 40;         // horizontal position of the graph
 
 void setup () {
 // set the window size:  and Font size
 f = createFont("Arial",12,true);
 F = createFont("Arial",24,true);
 size(700, 600);        
 
 // List all the available serial ports
 println(Serial.list());
 myPort = new Serial(this, Serial.list()[0], 9600);
  myPort.bufferUntil('n');
 // set inital background:
 background(70);
 }
 void draw () 
 {
   // everything happens in the serialEvent()
 }
 
 void serialEvent (Serial myPort) {
 // get the ASCII string:
 String inString = myPort.readStringUntil('n');
 
 if (inString != null) {
 // trim off any whitespace:
 
 print("Temperature: ");
 print(inString);
 println("Degree Celcius");
 inString = trim(inString);
 
 // convert to an int and map to the screen height:
 float inByte = float(inString+(char)9); 
 inByte = map(inByte, 0,117, 0, height);
 
 println(inByte);
 
  stroke(175);                       // temperature line
  line(40,height-40,40,0);
  
  stroke(175);                          // Time line
  line(40,height-40,width,height-40);
  
  stroke(100,100,255);                          // 30 degree line
  line(40,height-194,width,height-194);
 
 stroke(100,100,255);                          // 60 degree line
  line(40,height-344,width,height-344);
 
  textFont(F);       
  fill(255);
 
 textAlign(RIGHT);
  text("Temperature Plot Using Proccessing",680,40); 
  
  textAlign(RIGHT);
  text("And Arduino By Saddam Khan",653,70); 
  
  textAlign(RIGHT);
  text("Engineers Garage",580,100); 
 
   textAlign(RIGHT);
  text("TEMP",70,40);                         
  
  textAlign(RIGHT);
  text("TIME --->",650,580);    


   textAlign(RIGHT);
  text(inString,500,200);
 
   textAlign(RIGHT);
  text(" Degree Celsuis",560,230);
  
  
  fill(0);
 // int j;
  stroke(255);   
  for(int j=500;j>430;j--)
  {
  line(j,height-398,j,height-425);
  }
  stroke(0,0,0);
  textAlign(RIGHT);
  text(inString,495,200); 
 
  
 fill(240);
 textFont(f); 
 
  textAlign(RIGHT);
  text("(In Degree)",140,40); 
  
  textAlign(RIGHT);                 // 100 degree
  text("100 -",40,60);
  
   textAlign(RIGHT);                // 90 degree
  text("90 -",40,110);
  
   textAlign(RIGHT);                // 80 degree
  text("80 -",40,160);
  
   textAlign(RIGHT);                 // 70 degree
  text("70 -",40,210);
  
   textAlign(RIGHT);                // 60 degree
  text("60 -",40,260);
  
   textAlign(RIGHT);               // 50 degree
  text("50 -",40,310);
  
   textAlign(RIGHT);                 // 40 degree
  text("40 -",40,360);
  
   textAlign(RIGHT);
  text("30 -",40,410);
  
   textAlign(RIGHT);
  text("20 -",40,460);
  
   textAlign(RIGHT);
  text("10 -",40,510);
  
  textAlign(RIGHT);
  text("0 -",40,560);
 
 /*---- scale between 30 degree to 40 degree------*/
  
  textAlign(RIGHT);
  text("   -",40,370);
  
  textAlign(RIGHT);
  text("   -",40,380);
  
  textAlign(RIGHT);
  text("   -",40,390);
  
  textAlign(RIGHT);
  text("   -",40,400);
  
 // textAlign(RIGHT);
 // text("0 -",40,360);
 
 // draw the line:
 int shift=40;            // set trace origin
 stroke(255,0,0);              // trace colour
 for(int i=0;i<2;i++)
 {
// line(xPos, height-inByte-1, xPos, height - inByte);
   line(xPos, height-inByte-(shift+2), xPos, height-inByte-shift);
   xPos++;
 }
 if (xPos >= width)         //  go back to begining
 {
 xPos = 40;
 background(100); 
 } 
 }
 }

###


Circuit Diagrams

Circuit-Diagram-Arduino-Processing-Based-Temperature-Sensor-Data-Logger

Project Video


Related Articles Read More >

Wireless distance measurement using ultrasonic sensor
Computerized wireless Pick and Place Robot
Designing an Arduino-based ECG monitor using an AD8232 ECG sensor
Controlling Appliances Wirelessly using RF Technology

Featured Tutorials

  • Screenshot of Raspbian OS on Raspberry Pi RPi Python Programming 03: Raspberry Pi as Linux System
  • Raspberry Pi Models RPI Python Programming 02: Raspberry Pi Models
  • Raspberry Pi 4 RPi Python Programming 01: Introduction to Raspberry Pi 4
  • RPi Python Programming 05: Introduction to Python
  • RPi Python programming 04 RPi Python programming 04: Setting up Raspberry Pi Linux computer
  • Python Basics RPi Python Programming 06: Python basics

Stay Up To Date

Newsletter Signup

EE Training Center Classrooms

“ee

“ee

“ee

“ee

Recent Articles

  • Arduino’s L293D motor driver shield guide
  • NXP launches its first Wi-Fi 6E Tri-Band system-on-chip
  • Nexperia launches industry’s first 80 V RETs for high-voltage bus circuits
  • TDK releases low-profile medical sensors
  • Getting started with Raspberry Pi
...

RSS EDABOARD.com Discussions

  • Power controll on 230V with zero switching and PWM?
  • hysteresis variation mc sim
  • Creepage distance from primary to secondary of offline SMPS
  • HSPICE Simulation refuses to match the Spectre Simulation
  • Same geometry but slightly different results

RSS Electro-Tech-Online.com Discussions

  • How do I find the value of an exploded ceramic capacitor?
  • Any advice on identifying the HV wires on an old flyback.
  • How are you managing with the Covid-19 pandemic?
  • zener diode problem
  • Where has the fun gone?
Engineers Garage
  • Analog IC TIps
  • Connector Tips
  • DesignFast
  • EDABoard Forums
  • EE World Online
  • Electro-Tech-Online Forums
  • Microcontroller Tips
  • Power Electronic Tips
  • Sensor Tips
  • Test and Measurement Tips
  • 5G Technology World
  • About Us
  • Contact Us
  • Advertise

Copyright © 2021 WTWH Media LLC. All Rights Reserved. The material on this site may not be reproduced, distributed, transmitted, cached or otherwise used, except with the prior written permission of WTWH Media
Privacy Policy | Advertising | About Us

Search Engineers Garage

  • Projects and Tutorials
    • Circuit Design
    • Electronic Projects
      • 8051
      • Arduino
      • ARM
      • AVR
      • PIC
      • Raspberry pi
      • STM32
    • Tutorials
    • Components
  • Articles
    • EG Blogs
    • Insight
    • Invention Stories
    • How to
    • What Is
    • News
      • EE Design News
      • DIY Reviews
      • Guest Post
      • Sponsored Content
  • Forums
    • EDABoard.com
    • Electro-Tech-Online
    • EG Forum Archive
  • Digi-Key Store
    • Cables, Wires
    • Connectors, Interconnect
    • Discrete
    • Electromechanical
    • Embedded Computers
    • Enclosures, Hardware, Office
    • Integrated Circuits (ICs)
    • Isolators
    • LED/Optoelectronics
    • Passive
    • Power, Circuit Protection
    • Programmers
    • RF, Wireless
    • Semiconductors
    • Sensors, Transducers
    • Test Products
    • Tools
  • EE Resources
    • DesignFast
    • LEAP Awards
    • Oscilloscope Product Finder
    • Video
    • White Papers
    • Webinars
  • EE Learning Center
  • Women in Engineering