What is Mass Spectrometry
Mass Spectrometry or MS is used to determine the mass of particles. Determination of Elemental composition, analysis of chemical nature of compounds etc are some of the applications of Mass spectrometry. MS is based on the measurement of mass to charge ratio of charged particles. MS is a very good technique that finds applications in Pharmacokinetics, Protein characterization, Glycan analysis, Space exploration etc and also in Isotype tracking. Mass spectrometry has both qualitative and quantitative uses to study the physical, chemical and biological properties of compounds.
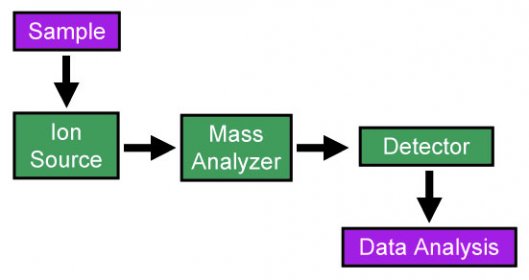
Mass spectrometry uses ionized chemical compounds to generate charged molecules. The protocol includes the following stages:
1. Vaporization of the sample
2. Production of charged particles using an electron beam
3. Separation of the charged particles or ions according to their mass to charge ratio using an electromagnetic field
4. Quantitative detection of the different ions
5. Conversion of the ion signal into mass spectra.
Components of the MS include:
Ion source that converts the gas phase sample into ions.
Mass analyzer– This is for sorting the produced ions according to their mass. The sorting takes place when the ions are subjected to the electromagnetic field.
Detector – This part calculates the amount of each type of ions produced and provides the data.

Mass spectrometry usually combines with Chromatography which is the preliminary step to identify the chemical molecule based on its movement on a supporting medium. Gas chromatography, Liquid chromatography, etc are combined with MS for analysis. After the separation of compounds in the sample mixture, the separated compounds are passed into the MS for converting into ions and for further mass analysis.
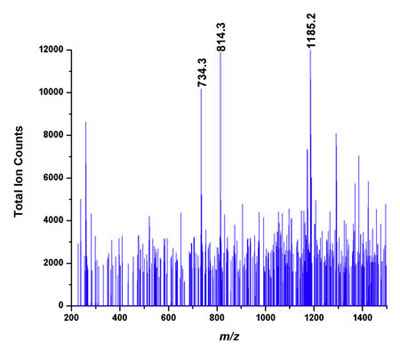
Mass Spectrum and Mass Chromatogram
The data representation in MS is called Mass spectrum. The Mass spectrum is the intensity plot representing mass to charge ratio in a chemical analysis.
Mass chromatogram is also used to represent the data. This may be SIM (Selected Ion Monitoring), TIC (Total Ion Current), SRM (Selected Reaction Monitoring Chromatogram) etc.

Contour Map
Contour Map is another method for data representation which uses mass to charge ratio in the X axis and intensity in the Y axis and time in Z axis to plot the graph. After the data representation, the data is interpreted through manual interpretation or using software.
Precursor Ion Fingerprinting
Precursor Ion Fingerprinting is the latest development in MS which is used for the structure elucidation of biomolecules and identification of individual structure.
Filed Under: Electronic Projects


Questions related to this article?
👉Ask and discuss on Electro-Tech-Online.com and EDAboard.com forums.
Tell Us What You Think!!
You must be logged in to post a comment.