While exploring the scope of Raspberry Pi in different hobby projects, a blogger named Rajiv decided to develop an application that could give out a graphical representation of the signals/values in real time. The idea clicked his mind when he felt the need to have a medium that could represent the values of temperature, humidity, pressure etc. through a GUI based application and that too in real time. His aim was to run an application on Raspberry Pi that could read and process these values via UART, SPI, and I2C. So the main task was to be able to process the received values and translate them into a graphical form.
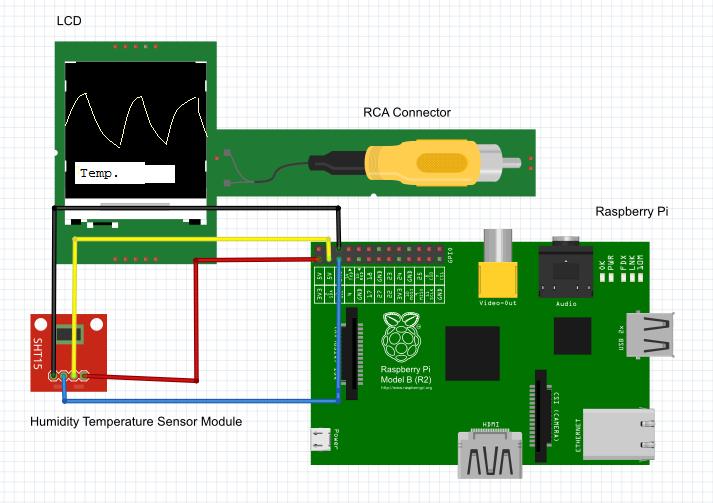
Figure 1: Real-Time Signal plotting Application for Raspberry Pi
The functioning of this model could be understood with the example of a humidity temperature sensor module. If the temperature sensor is attached to a Raspberry Pi via I2C connector, the temperature readings would be read by the microcontroller and then an application running on the Pi would process these values in real time which would be transmitted to the LCD linked with the Pi. Then the LCD would graphically represent the real time temperature readings processed by the system.
Applying the same concept in his project, Rajiv started to gather the components to be utilized in the DIY task, namely a Raspberry Pi Model B, Intex 600mAh battery pack, 4GB SD card, and a Wi-Fi adapter. He put the Raspberry Pi in an acrylic case and since it had just two USB ports, he connected one of them to a USB port hub and the other to the Wi-Fi adapter. Further, he flashed the SD card into the Pi and provided 5V power from a battery source that could last for 5-6 hours.
After that, he connected the LCD to the Pi along with the mouse and keyboard through the USB hub. When the setup was complete, he went on to set up the Wi-Fi connection using a wireless USB adapter. This was important because the application needed certain packages to be installed and hence the Pi was required to connect to the internet. For this, he used his android’s hotspot and connected it to the Pi. When the internet connection was available, he installed the required packages using the apt-get method.
In the final step, he went on to build and set up the sources that included some downloading, copying, extraction and configuration. Later he commented a few lines and made the required changes, after which the programming part came to an end. This finally led to the plotting of the graph denoting the values in real time. If you intend to work on a similar project then you can watch out the link provided below which includes all the details.
Filed Under: Reviews

Questions related to this article?
👉Ask and discuss on Electro-Tech-Online.com and EDAboard.com forums.
Tell Us What You Think!!
You must be logged in to post a comment.