In this tutorial, we’ll learn how to interface a spectroscopic sensor with Arduino. Spectroscopy refers to the study of the spectra produced when material interacts with or emits light. Researchers analyze the change(s) in a light spectrum and its attributes — such as its frequency or wavelength — when it’s exposed to matter (a gas, liquid, solid, etc.).
Depending on its physical properties, matter will either allow the light to pass or absorb some or all of its frequencies. For example, black bodies fully absorb light — including all of the frequencies in an electromagnetic spectrum. This means that we can distinguish materials (or matter) by exposing them to a known light source and studying their frequency absorption.
Currently, there is only one cost-effective spectrometer that’s available for a do-it-yourself (DIY) project such as this, the AS7265x. It’s a combination of three individual sensors that offer:
1. Visible light (VL): AS72651
2. Ultraviolet light (UV): AS72652
3. Near-infrared light spectrum (NIR): AS72653
Each sensor has a dedicated LED adjacent to it and, combined, they form a triad.
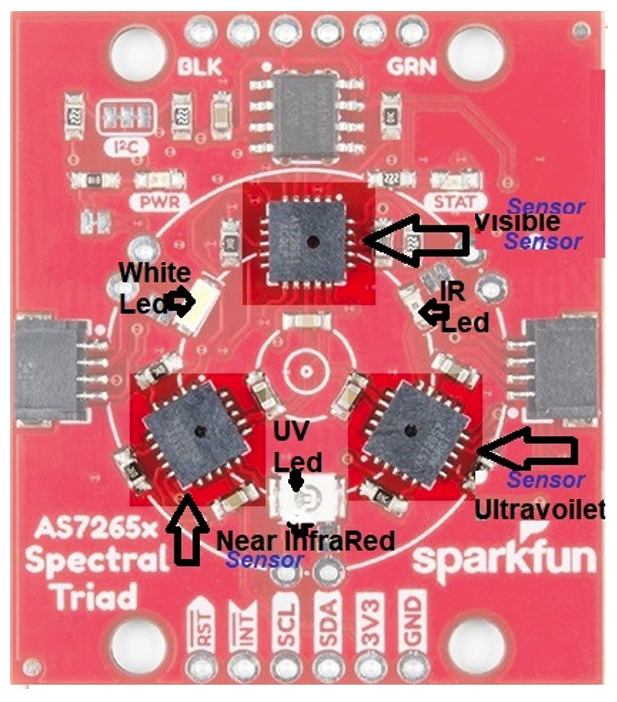
These onboard LED’s are powerful enough to illuminate nearby objects and reflect back the light. However, you can also use external LED’s for a greater level of reflected/incident light frequencies.
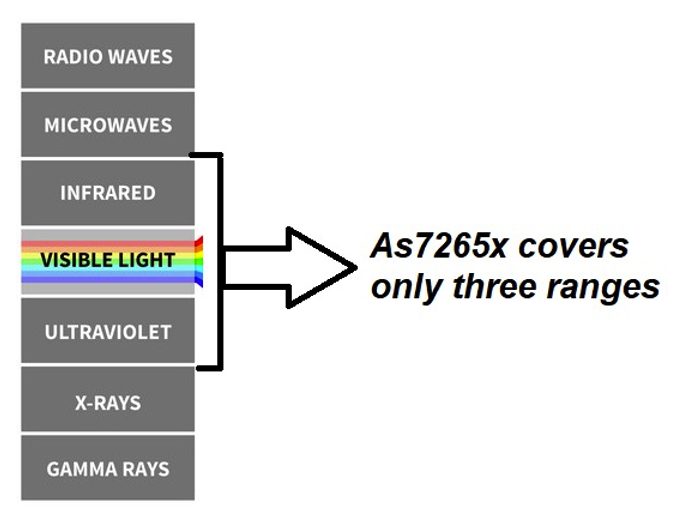
Unfortunately, the spectral triad can only cover a small portion of the light spectrum. DIY sensors are limited. To cover the full spectrum, individual sensors can be cascaded together.
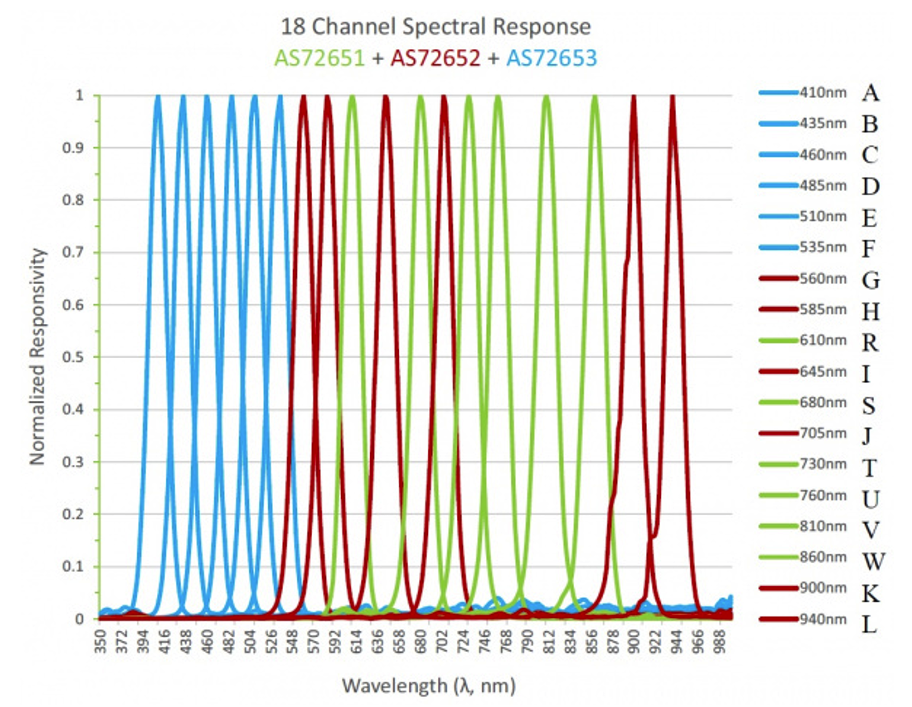
The AS7265x triad outputs 18 values (A, B, C, D, E, F, G, H, R, I, S, J, T, U, V, W, K, L), which correspond to 18 different light frequencies. When a light source that’s within the sensor range (VI, UV, NIR) is detected, the light’s frequency is rounded off to the nearest range within these 18 frequencies.
Here’s the frequency range…
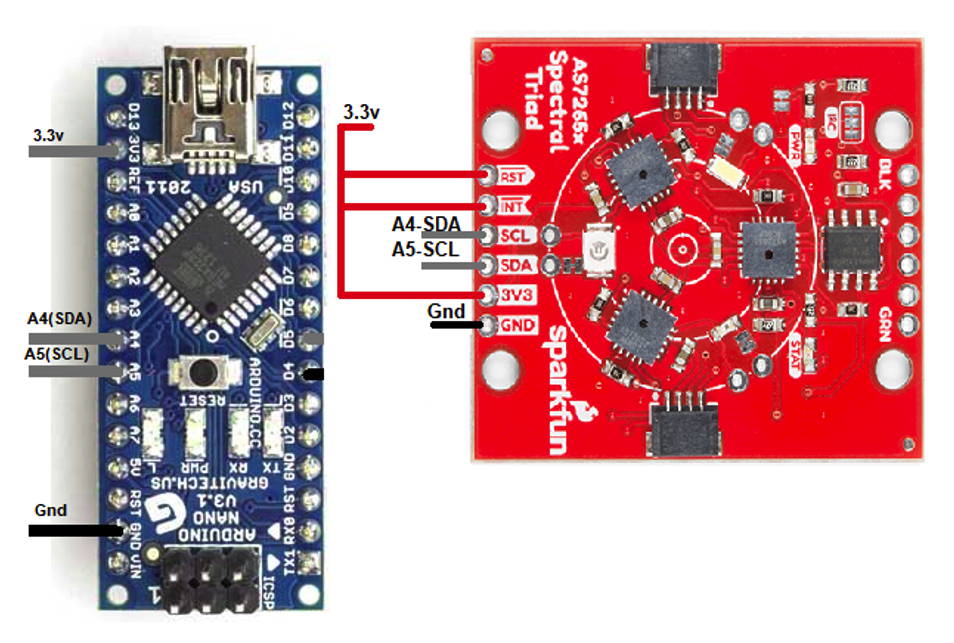
Essentially, the AS7265x “communicates” with the I2C protocol’s external modules. It operates on 3.3V, which is ideal for the I2C port. The visible light sensor acts as the master while the NIR and UV light spectrums are slaves.
Arduino NANO is best suited for this project and its connections with the sensor are shown here…
The code
First, import and initiate the SparkFun library for the AS7265x sensor. The setup function for Arduino’s serial monitor is initialized at a 9600 baud rate.
Then, the sensor must be started and polled to ensure its fully powered up and working.

In the loop function, the statement takeMeasurements() will note the frequencies that are reflected from the exposed object or material. To determine which of the 18 frequencies are absorbed, you’ll need to call all of the frequencies’ status functions. The getCalibratedx() function will let you see the status of the individual frequencies.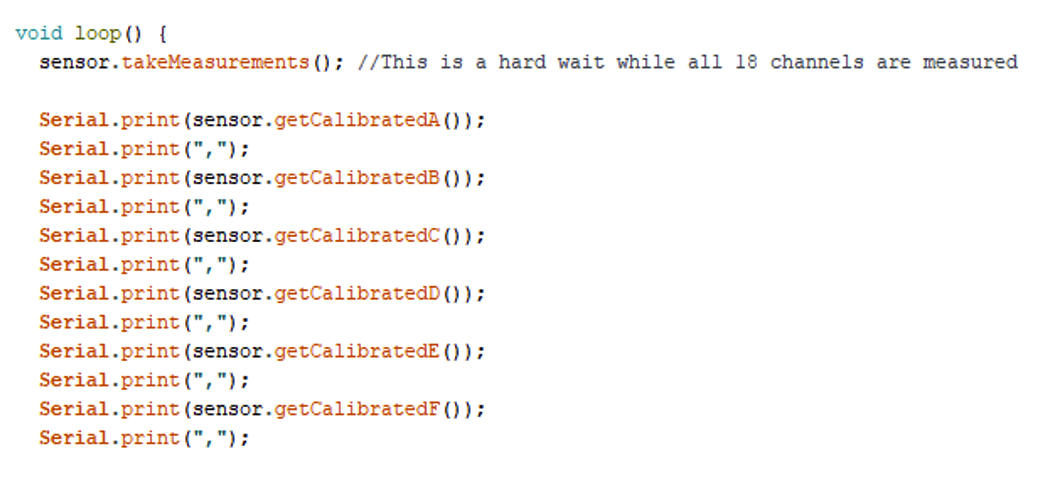
The above function only measures the raw light and natural frequencies in a particular environment. To measure their exact values, it’s necessary to switch on the sensor’s VI, UV, and NIR LED’s.
This statement allows us to take readings with the LED switched on: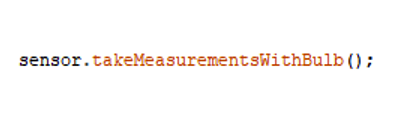
Otherwise, you can switch on the LED’s permanently by placing these statements in the setup loop:

For the results, open the serial monitor at the 9600 baud rate. The spectral properties of the material/matter can be studied using the above DIY spectrometer.
Here’s what you’ll need:
You may also like:


Filed Under: Microcontroller Projects

Questions related to this article?
👉Ask and discuss on EDAboard.com and Electro-Tech-Online.com forums.
Tell Us What You Think!!
You must be logged in to post a comment.