In this article, we will learn about various filter responses. A filter response helps to understand the difference between a filter’s input signal and output signal. Keeping an eye on filter responses is necessary to analyze their behaviors. To have a better understanding of the processed signal, it is important to analyze that signal and the resulting changes produced by the system.
In electronics, signal analysis is done by understanding the behavior of the signal in the time and frequency domain. In this article, we will look at the important signal responses produced by the two domains: Time and Frequency.
Time Domain Response
A disturbance or sudden change in an input signal from its steady state is called a transient. There are methods to study the hardware filter’s time domain and frequency domain response. The time domain response of the hardware filter is analyzed under transient conditions.

Fig. 1: Time domain vs. Frequency domain
Two techniques are used to move between the time domain and the frequency domain response of the filter—Fourier Transform and Laplace Transform. To apply these two techniques, a mathematical function is generated that theoretically models the output of any system at every possible input. That is called the transfer function, which is the ratio of the output to the input time response. The impulse response of a filter can be used to define its bandwidth. The time domain response is a practical consideration in communications systems, where different modulation schemes use both amplitude and phase information.
- Impulse response
An infinitely narrow pulse with an infinitely high area of unity (small area of high amplitude) is defined as an impulse response. Physically it is impossible to realize impulse response. If the filter has an impulse width lesser than a filter rise time (filter starts filtering), the filter’s response will be the actual impulse response.
The filter’s impulse response in the time domain is proportional to the filter’s bandwidth in the frequency domain. The narrower impulse means the wider the bandwidth of a filter. The pulse amplitude can be written as ùc/ð, which is proportional to the filter’s bandwidth. The height becomes taller with wider bandwidths. The pulse width can be written as 2ð/ùc, which is inversely proportional to the bandwidth of a filter. The product of the amplitude and the bandwidth becomes a constant.
It isn’t easy to calculate the filter response without using the Fourier and Laplace transforms. The Laplace transform converts multiplication to addition and division to subtraction, turning them into simple algebraic equations easier to deal with. The Fourier transform works in the opposite direction of the Laplace transform.
As stated, the impulse response is directly related to the filter bandwidth. So amplitude discrimination (ability to distinguish between the desired signal and noise) and time are inversely proportional. That is why it is said that the filters with the best amplitude response have the worst time response. on the technical design, there are types of filters like Butterworth, Chebyshev, and Bessel filters. Every filter has its own unique design characteristics. Chebyshev filter gives better amplitude discrimination than Butterworth, and Butterworth gives better amplitude discrimination than the Bessel filter. Bessel filters are best in the time domain. Time domain rank can be given as: Bessel followed by Butterworth and then Chebyshev.
Increasing the filter order increases the impulse response but results in greater band limitation, degrading the time response. Degradation of time response means increasing frequency discrimination and the quality factor of the individual section, which implies a longer time response.
- Step response
The integral of the impulse response of a filter is called step response. The step response is useful in time domain response because it contains the information of a signal in a recognizable view. Most of the generalities applied to the impulse response can be used for the step response. The rise time slope of the step response is equal to the peak response of the impulse response, and the product of the rise time and the bandwidth is constant. The impulse response has a function equal to unity like that step response also has a 1/s. Both of these expressions are dimensionless and hence can be normalized.
The step response of a filter is used to determine the envelope distortion (variations in the rate of change phase shift over the frequency) of a modulated signal. Overshoot (when a signal crosses its limited area) and ringing are the two most important parameters of a filter’s step response. On an excellent pulse response, overshoot should be minimal. Ringing should decay asap so as not to disturb subsequent pulses.
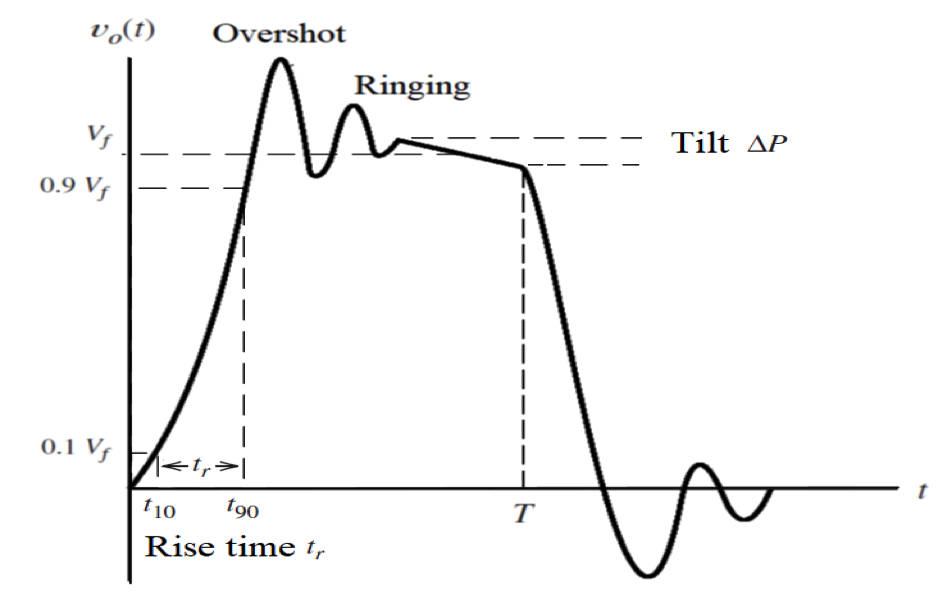
Fig. 2 : Overshoot and ringing of the signal
Real-life communication signals are not made of step or impulse responses, so one cannot get a complete, accurate output estimation using transient response curves. There are several CAD (Computer Aided Design) software programs that can perform the mathematical calculations of the impulse and step response.
Frequency Domain Response
Frequency domain response is the quantitative measurement of the phase and amplitude of the output as a function of the input frequency.
There are transfer functions that can satisfy a filter’s attenuation and phase requirements. The transfer function can determine the importance of FDR (Frequency domain response) vs. TDR (time domain response).
- Butterworth filter response
A Butterworth filter has the smoothest frequency response in the passband of the filter. It also has a very simple transfer function equation. It is relatively simple to calculate the coefficient of polynomials, because of the easy transfer function equation.
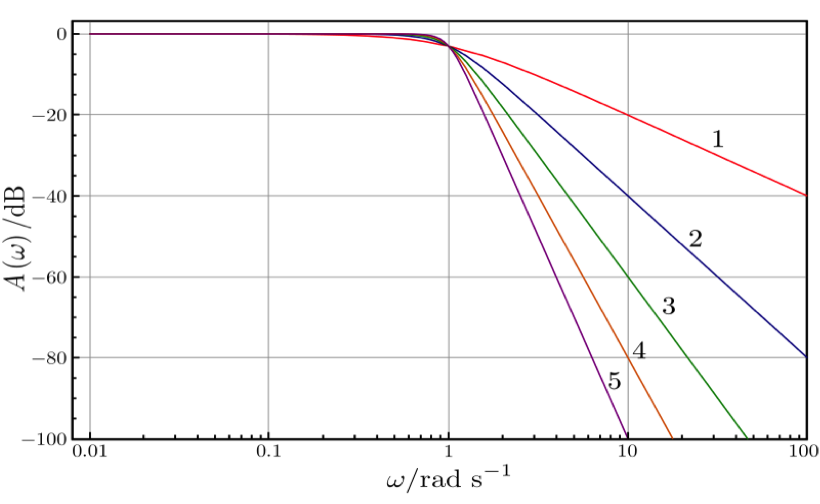
Fig. 3: Butterworth filter response
The best reconciliation between phase response and attenuation is the Butterworth filter. It has no ripple in the stop band and passband, which is why it is sometimes called a maximally flat filter. A Butterworth filter achieves its flatness by the wide transition from pass band to stop band, with calculated transient characteristics.
In the S-plane, the normalized pole of the Butterworth filter lies on the unit circle. And the pole positions are:
-sin ((2k-1)ð/2n) + j cos ((2k-1)ð/2n) k=1,2….n
Where k – pole pair number, n – number of poles
On the unit circle, the poles are spaced equidistant, which means it has equal angles between the poles.
ù0, and Q may be calculated by the given pole locations. Component values can then be determined by the values of a filter. Frequency and impedance normalized filters used for passive filters are normalized to an impedance of 1 Ω and frequency of 1 rad/sec. This allows the comparison of the frequency domain and time domain response of the filters on equal footing. The normalization of the Butterworth filter is -3dB response at ù0 =1.
The Butterworth filter’s element values are more practical and less critical than other filters.
- Chebyshev filter response
A Chebyshev filter has a very sharp transition from the passband to the stopband of a filter. Depending on the type of Chebyshev filter used, this sharp transition causes ripples in the passband and the stopband.

Fig. 4: Chebyshev filter response
This filter has a smaller transition region than the Butterworth filter for the same order filter but has ripples in the passband. Chebyshev criterion has the maximum ripples in the pass band, and the Chebyshev filter minimizes the height of the maximum ripple of the Chebyshev criterion.
At dc, these filters have 0 dB relative attenuation. The number of ripple cycles in the passband is equal to the order of the filter. This extends from 0 to the max ripple value of odd order; even order filters have a gain equal to passband ripple.
Moving the poles of the Butterworth filter (forming an ellipse) can determine the poles of the Chebyshev filter. This can be done by multiplying the imaginary part by k1 and the real part of the pole by kr.
And these values can be determined by:
Kr = sinh A
K1 = cosh A
Where:
A = (1/n)sinh-1(1/Ꜫ)
Where n- filter order and
Ꜫ = sqrt(10R-1)
Where:
R = RdB/10
Where:
RdB – pass band ripple
The 3 dB bandwidth of the Chebyshev filter is given by:
A3dB = (1/n) cosh-1(1/Ꜫ)
- Bessel filter response
The Bessel filter has a linear phase response in the passband. Because of this linearity, all signal frequency gets delayed by the same amount of time, making it idea for image processing and control applications. This filter needs to be higher-order to get the same transition from the passband to the stopband as the Chebyshev or Butterworth.
The below figure shows the comparison between the three filters’ responses.

Fig. 5: Comparison between Butterworth, Chebyshev, and Bessel filters.
A Butterworth filter has good transient behavior with fairly good amplitude, while the Chebyshev filters improve the amplitude response at the sacrifice of transient behavior. But the better transient response is optimized by the Bessel filter due to the linear phase in the pass band—that means poorer frequency response.
The poles of the Bessel filter lie on a circle like the Butterworth filter but are spaced at approximately equal distances, unlike those related to the real axis rather than equal angular distances. The real and imaginary pole location for the Bessel filter is presented in the figure below.
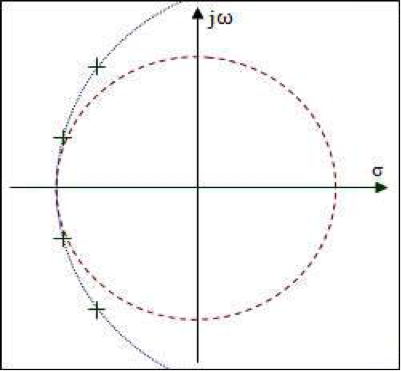
Fig. 6: Real and Imaginary pole location for Bessel filter
To imply the time domain and frequency domain response or to switch between them, a mathematical equation is generated of the filter, which is done by the transfer function. Therefore, it is necessary to understand some basic functions and properties of a transfer function.
You may also like:


Filed Under: Featured Contributions, Hardware Filters, Tutorials

Questions related to this article?
👉Ask and discuss on Electro-Tech-Online.com and EDAboard.com forums.
Tell Us What You Think!!
You must be logged in to post a comment.