Simulink and MatLab are great tools to simulate and analyze an application. Simulink offers blocks (software, hardware, arithmetic, functional, electrical, etc.) which can be put together for monitoring or generating various kinds of functions and controls. Putting blocks together gives a clear image of the system. Through blocks, control and data flow sequentially.
Let’s see an example of data flow. An external hardware module (Arduino) will send data packets to Simulink. Simulink process the received data and displays the output on a graph.
Before beginning any further, I expect you are familiar with Simulink its blocks and its hardware support packages. Simulink offers hardware packages for various microcontrollers/processors/soc’s Arduino, intel processors, Stm32, FPGA’s, and various other development kits. Please make sure you have the Simulink Arduino support package installed. We will use the Arduino package in this example.

You can find the Arduino support package at Simulink > Simulink Support Package for Arduino Hardware. Under the support package, various blocks are grouped based on attributes.
Random input
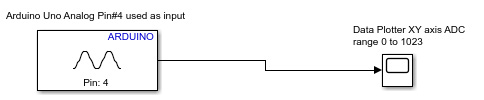
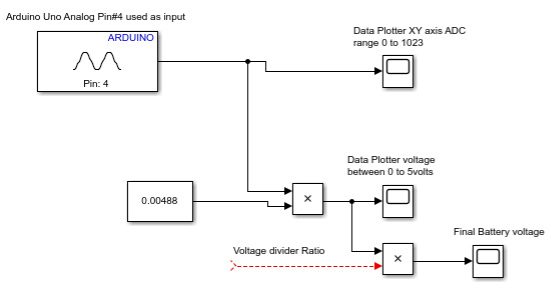
Arduino analog pin can monitor analog voltage from 0 to 5 volts. We need just two blocks to visualize the analog input voltage: analog input block and display block.
Analog input block reads what is present on the Arduino analog pin. You must specify the analog pin in the properties of the block. Just click the block and enter the analog pin in the popped window.
The analog input block is equivalent to analogRead() function of Arduino. It returns a value between 0 to 1023. Arduino ADC (analog to dc converter) is 10 bits wide.
Plot block plots the input it receives. In our case, this is from Arduino analog pin#4. Plot X and Y-axis parameters can be set by double-clicking the block and inputting the parameters. By default, the data will be displayed on X-axis.
Place the blocks in the Simulink workspace and connect them. Connect Arduino to your PC. Now press the RUN button on Simulink. That’s all
If the graph is not displaying, double-click the graph block while the simulation is running. The random value will display on the graph because our analog pin is open; nothing is connected to it. Attaching an analog source (variable resistor/potentiometer) to the analog pin will force the graph to display discrete and user-controlled inputs.
Converting analog range (0-1023) to TTL (0-5 volts)
The Arduino statement to convert from analog range to TTL is below. How can we implement this statement in Simulink?
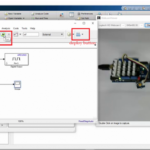
Break the statement into chunks. Divide operation can be one chuck and multiply the other. Dividing 5/1023 results 0.00488. Multiply is between sensorValue (0-1023) and 0.00488. Select a multiply block from the arithmetic library and place it in the workspace.
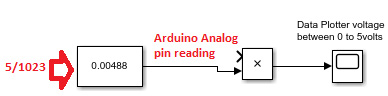
Select a constant block from Simulink general block category place. Place it in the workspace and initialize it with 0.00488. Block represents the same Arduino statement float i=0.00488. Now place a multiply block from the arithmetic block and connect its one input-output from a constant block.
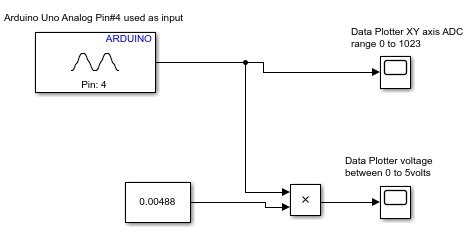
The other input of the multiply block is the Arduino analog input. The whole system is represented above.
Battery voltage monitoring over time
Monitoring a DC battery voltage is nearly the same as what we studied so far. We need an ADC to measure the battery voltage.
Suppose we have a 12volt DC battery. We can’t connect the Arduino analog pin directly with 12 volts battery. Arduino is 5 volts tolerant so that Arduino analog pins can accept only 5 volts. Greater than 5 volts will burn the analog channel, and the probability of Arduino failure is high.
We need to lower the voltage for 5 volts tolerance. The voltage divider is a circuit to divide voltage. The voltage divider or resistor divider is composed of two resistors in series. Recall in series voltage divides among each resistor. The voltage drop across each resistor depends on the resistor value.
We need to select resistor values to increase the voltage by 5 volts in all conditions across the bottom resistor. A resistor divider circuit must be utilized to calculate the bottom resistor value. Select a fixed top resistor value.
In our case, Vout=5 volts, Rtop=Fixed (Suppose 12kohm), Vin=12 volts, Rbottom=?
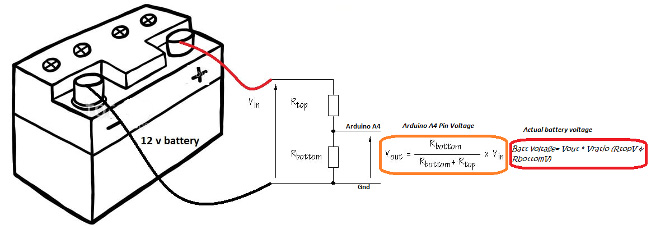
The bottom resistor voltage is input to the Arduino analog pin.
How can 5 volts input to Arduino yield battery voltage?
Answer=>Voltage divider ratio. We calculated the Rbottom resistance above. Now we have all the parameters. Vout, Vin, Rbottom, and Rtop.
The voltage divider ratio is input voltage divided by the voltage across Rbottom. This ratio always remains the same. I discussed this ratio in another tutorial. Visit it if you want to learn more about it.
Multiplying this ratio with the voltage gives us the exact battery voltage.
So in our Simulink system, we just need to add a multiplier, a constant(ratio), and a plotter. The end battery voltage monitoring system is shown below.
The advantage of Simulink is it is easy as it requires blocks which need to be placed in sequential order. The system is predictable, saves time, and debugging/finding errors is a lot easier than Arduino code. Moreover, we have plenty of blocks for almost every operation, from mechanical to electrical.
Let’s DIY this project: Where to purchase parts?
Mouser : Arduino
Mouser : Battery
You may also like:
Filed Under: Featured, Microcontroller Projects
Log in to leave a comment:
Lost your password?
Don't have an account? Register here